CANVAS: A Benchmark for Vision-Language Models on Tool-Based UI Design

1KAIST, 2Korea University, 3Yonsei University
*Equal contribution

Canvas evaluates vision-language models' ability to design UIs through tool invocation.

Qualitative Results

Abstract

User interface (UI) design is an iterative process in which designers progressively refine their work with design software such as Figma or Sketch. Recent advances in vision–language models (VLMs) with tool invocation suggest these models can operate the design software to edit a UI design through iteration. Understanding and enhancing this capacity is important, as it highlights VLMs' potential to collaborate with designers within conventional software. However, as no existing benchmark evaluates the tool-based design performance, the capacity remains unknown.

To address this, we introduce Canvas, a benchmark for VLMs on tool-based user interface design. Our benchmark contains 598 tool-based design tasks paired with ground-truth references sampled from 3.3K mobile UI designs across 30 function-based categories.

In each task, a VLM updates the design step-by-step, through context-based tool invocations (e.g., create a rectangle as a button background), linked to design software. Specifically, Canvas incorporates two task types: (i) design replication evaluates the ability to reproduce a whole UI screen; (ii) design modification evaluates the ability to modify a specific part of an existing screen. Results suggest that leading models exhibit more strategic tool invocations, improving design quality. Furthermore, we identify common error patterns models exhibit, guiding future work in enhancing tool-based design capabilities.

Benchmark Overview

Dataset

Canvas contains 598 design tasks from 3,327 mobile UI designs across 30 categories. Each design includes an image and a JSON file representing the Figma node structure. This file organizes components (e.g., vector, text, rectangle) in a hierarchical tree with attributes like position, size, and color.

Data Characteristics

AFrequency of the five most frequent UI design types, with other categories grouped. BThe distribution of node tree depth is similar across the replication and modification sets with a Gaussian-like pattern. CThe node count distribution is also similar across both sets. DThe skewed frequency of node types per design indicates common patterns in component usage.

Task Design

To reflect real-world user scenarios, Canvas consists of two types of user interface (UI) design tasks: ADesign Replication and BDesign Modification.

Tasks Overview

Evaluation Metrics

Our evaluation framework measures both perceptual and semantic alignment between generated and reference designs, based on the model of human visual processing. We assess similarity at three hierarchical levels:

  • Feature-level (SSIM): Compares low-level features like size and shape using the Structural Similarity Index Measure.
  • Pattern-level (Saliency Similarity): Compares visual saliency maps to see how well patterns that guide human focus are replicated.
  • Object-level (BLIP Caption Similarity): Generates captions for designs and compares their semantic meaning.

Additionally, Component-wise Similarity evaluates the accuracy of individual UI components by matching them between designs and assessing four key attributes: component match rates, position, text, and color.

Key Results

Our evaluation of five state-of-the-art VLMs reveals important insights about tool-based UI design capabilities.

Highlights

  • Replication Task: Gemini-2.5-Pro achieved highest SSIM (0.774) and Saliency (0.630)
  • Modification Task: GPT-4.1 led across all metrics (SSIM: 0.890, Saliency: 0.861)

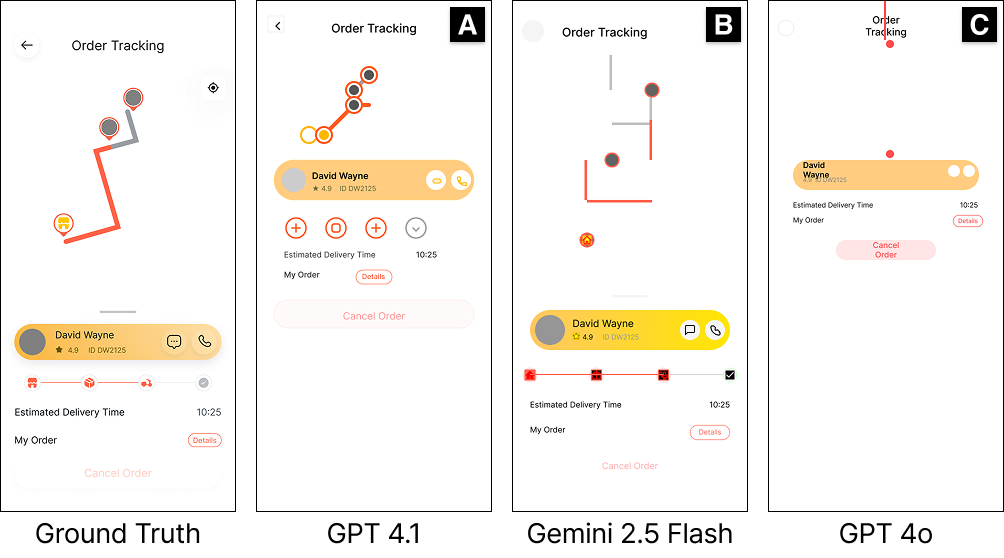
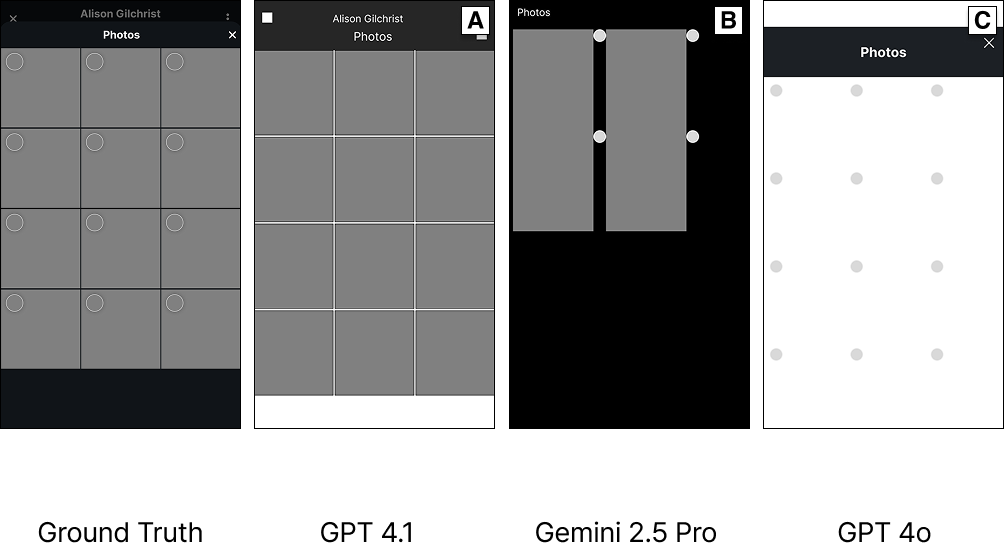
Replication Strategy

High-scoring models invoke a wider range of tools across more turns, often reusing components strategically (e.g., copy and propagate) rather than recreating them sequentially.

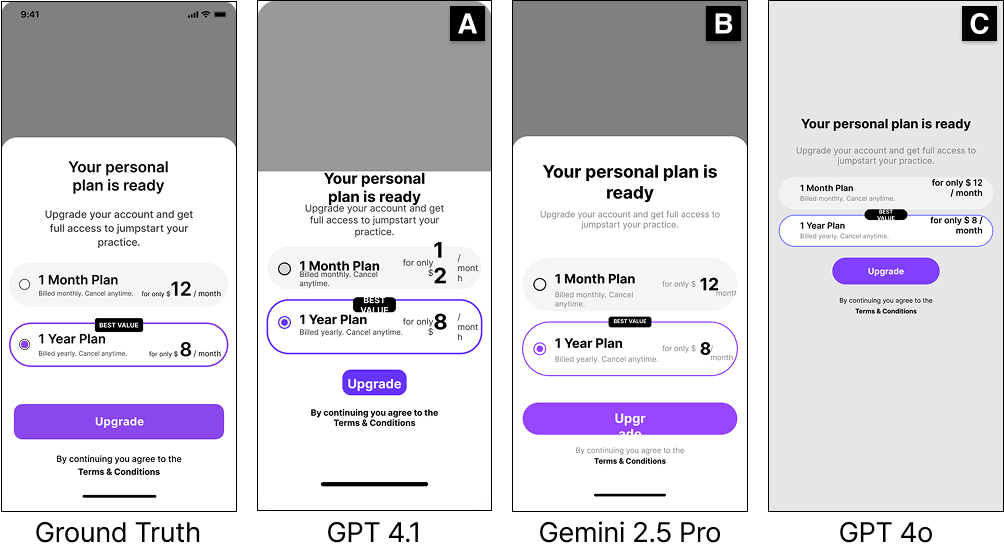
Modification Precision

Small inaccuracies in edits propagate unevenly across metrics, making precision more important than diversity. Models with higher tool precision achieve better modification scores.

Human Alignment

Our evaluation metrics (saliency, BLIP, component similarity) strongly correlate with human judgments of design quality, confirming that they capture expert preferences, achieving 75% prediction accuracy for human pairwise judgments.

Quantitative Results

Performance comparison of five state-of-the-art vision-language models on CANVAS benchmark tasks.

Model SSIM Saliency BLIP Comp. Wise
GPT-4o 0.739 (±0.172) 0.478 (±0.136) 0.495 (±0.250) 0.671 (±0.087)
GPT-4.1 0.767 (±0.129) 0.612 (±0.137) 0.655 (±0.251) 0.716 (±0.075)
Claude-3.5-Sonnet 0.725 (±0.180) 0.483 (±0.151) 0.518 (±0.272) 0.666 (±0.089)
Gemini-2.5-Flash 0.736 (±0.184) 0.619 (±0.149) 0.571 (±0.270) 0.702 (±0.100)
Gemini-2.5-Pro 0.774 (±0.117) 0.630 (±0.162) 0.620 (±0.273) 0.694 (±0.094)

Error Analysis

We identify common failure patterns in current VLMs for tool-based design tasks.

Error Type: Position

Geometric Operations

Models struggle with geometric properties, producing the wrong count of markers, irregular path directions, and inconsistent component layouts.

Error Type: Layout

Layout Operations

Models often misinterpret auto-layout rules, leading to broken alignment between interface elements or pushing components beyond the visible screen.

Error Type: Text

Text Operations

Models frequently fail to size text components correctly, causing labels to overflow their frames and disrupt both alignment and overall readability.

BibTeX

@article{jeong2025canvas,
      title={CANVAS: A Benchmark for Vision-Language Models on Tool-Based User Interface Design}, 
      author={Daeheon Jeong and Seoyeon Byun and Kihoon Son and Dae Hyun Kim and Juho Kim},
      year={2025},
      eprint={2511.20737},
      archivePrefix={arXiv},
      primaryClass={cs.CV},
      url={https://arxiv.org/abs/2511.20737}, 
}